
On Data Quality
A systematic way to think about data quality.

This is the first of two essays on data quality. Today’s essay is about the basics: what is data quality, and how should we think about it? The second essay, publishing next week, is about the fun stuff: data quality in an AI world.
Introduction
Data quality. We love it, we want it, we praise it, we aspire to it. Even in these benighted and degenerate times, if there’s one belief that unites all sensible individuals, it is the belief that data quality is a Good Thing.
It’s a pity, then, that nobody seems to know what data quality is.
Ask six practitioners to define data quality and you’ll get six different answers. In fact it’s worse than that: give the same data to six practitioners, and you’ll get six different evaluations of its quality. Data is the elephant and we are the blind men of Hindustan.
Fortunately, Pivotal is here to save the day. Today we shall learn all about data quality. Read on!
Standards Are Poor
Let’s start with the “standard” definitions of data quality. They are, unfortunately, not very helpful.
ISO 8000 defines quality data as data that meets its stated requirements. This is one of those tautological statements that is perfectly accurate and completely useless.
ISO 25012 defines data quality using 15 attributes, including all the usual suspects: accuracy, completeness, consistency and so on. This too is correct, but incomplete.
I take a somewhat different approach.
A Modest Assertion
I begin with an assertion: data has no innate quality. Quality is a purely emergent phenomenon, conditional entirely on use case.
Readers of How to Price a Data Asset will recognize this line of thinking. In that essay, I argued that data has no intrinsic value; instead, the value of data is the value of what can be done with it.
Data quality is that which increases data value.
Since data value is a function of usage, so too is data quality. Data quality can only be assessed with reference to what can be done with the data.
We care about data quality precisely because it allows us to do more; do better, faster, cheaper; or just do differently with our data.
This is still a bit abstract and hand-wavy. We’re going to make it more concrete.
Levels of the Game
Our first insight is this: data quality comes in levels. These levels are not separate or mutually exclusive; they exist simultaneously; and much of the noise around data quality stems from level confusion.
These levels are ordered and dependent. Ordered: data quality can pertain to individual record, to data corpus, to application, or to business outcome. And dependent: each level requires the ones below and above, for coherence and usability.
I’ll explain all these terms in a bit, but first, let’s examine the levels and what they cover.
Granular Quality
The first level of data quality is granular or unit-level quality.
Think of an individual “unit” of data – a single database record, or sentence, or question-answer pair, or labeled example. You can test this granular unit for accuracy, precision, recency, well-formed-ness, internal consistency, plausibility, provenance, interpretability, confidence, and more1 . This is what many data quality evaluators do, and where they stop; it’s the realm of ISO 25012, of observability and monitoring.
Two facts jump out. First, all these quality attributes exist at the level of individual units of data. You don’t need to inspect other records to know if a given record is accurate, precise, recent and so on. This is why we call this granular quality. Each unit stands alone.
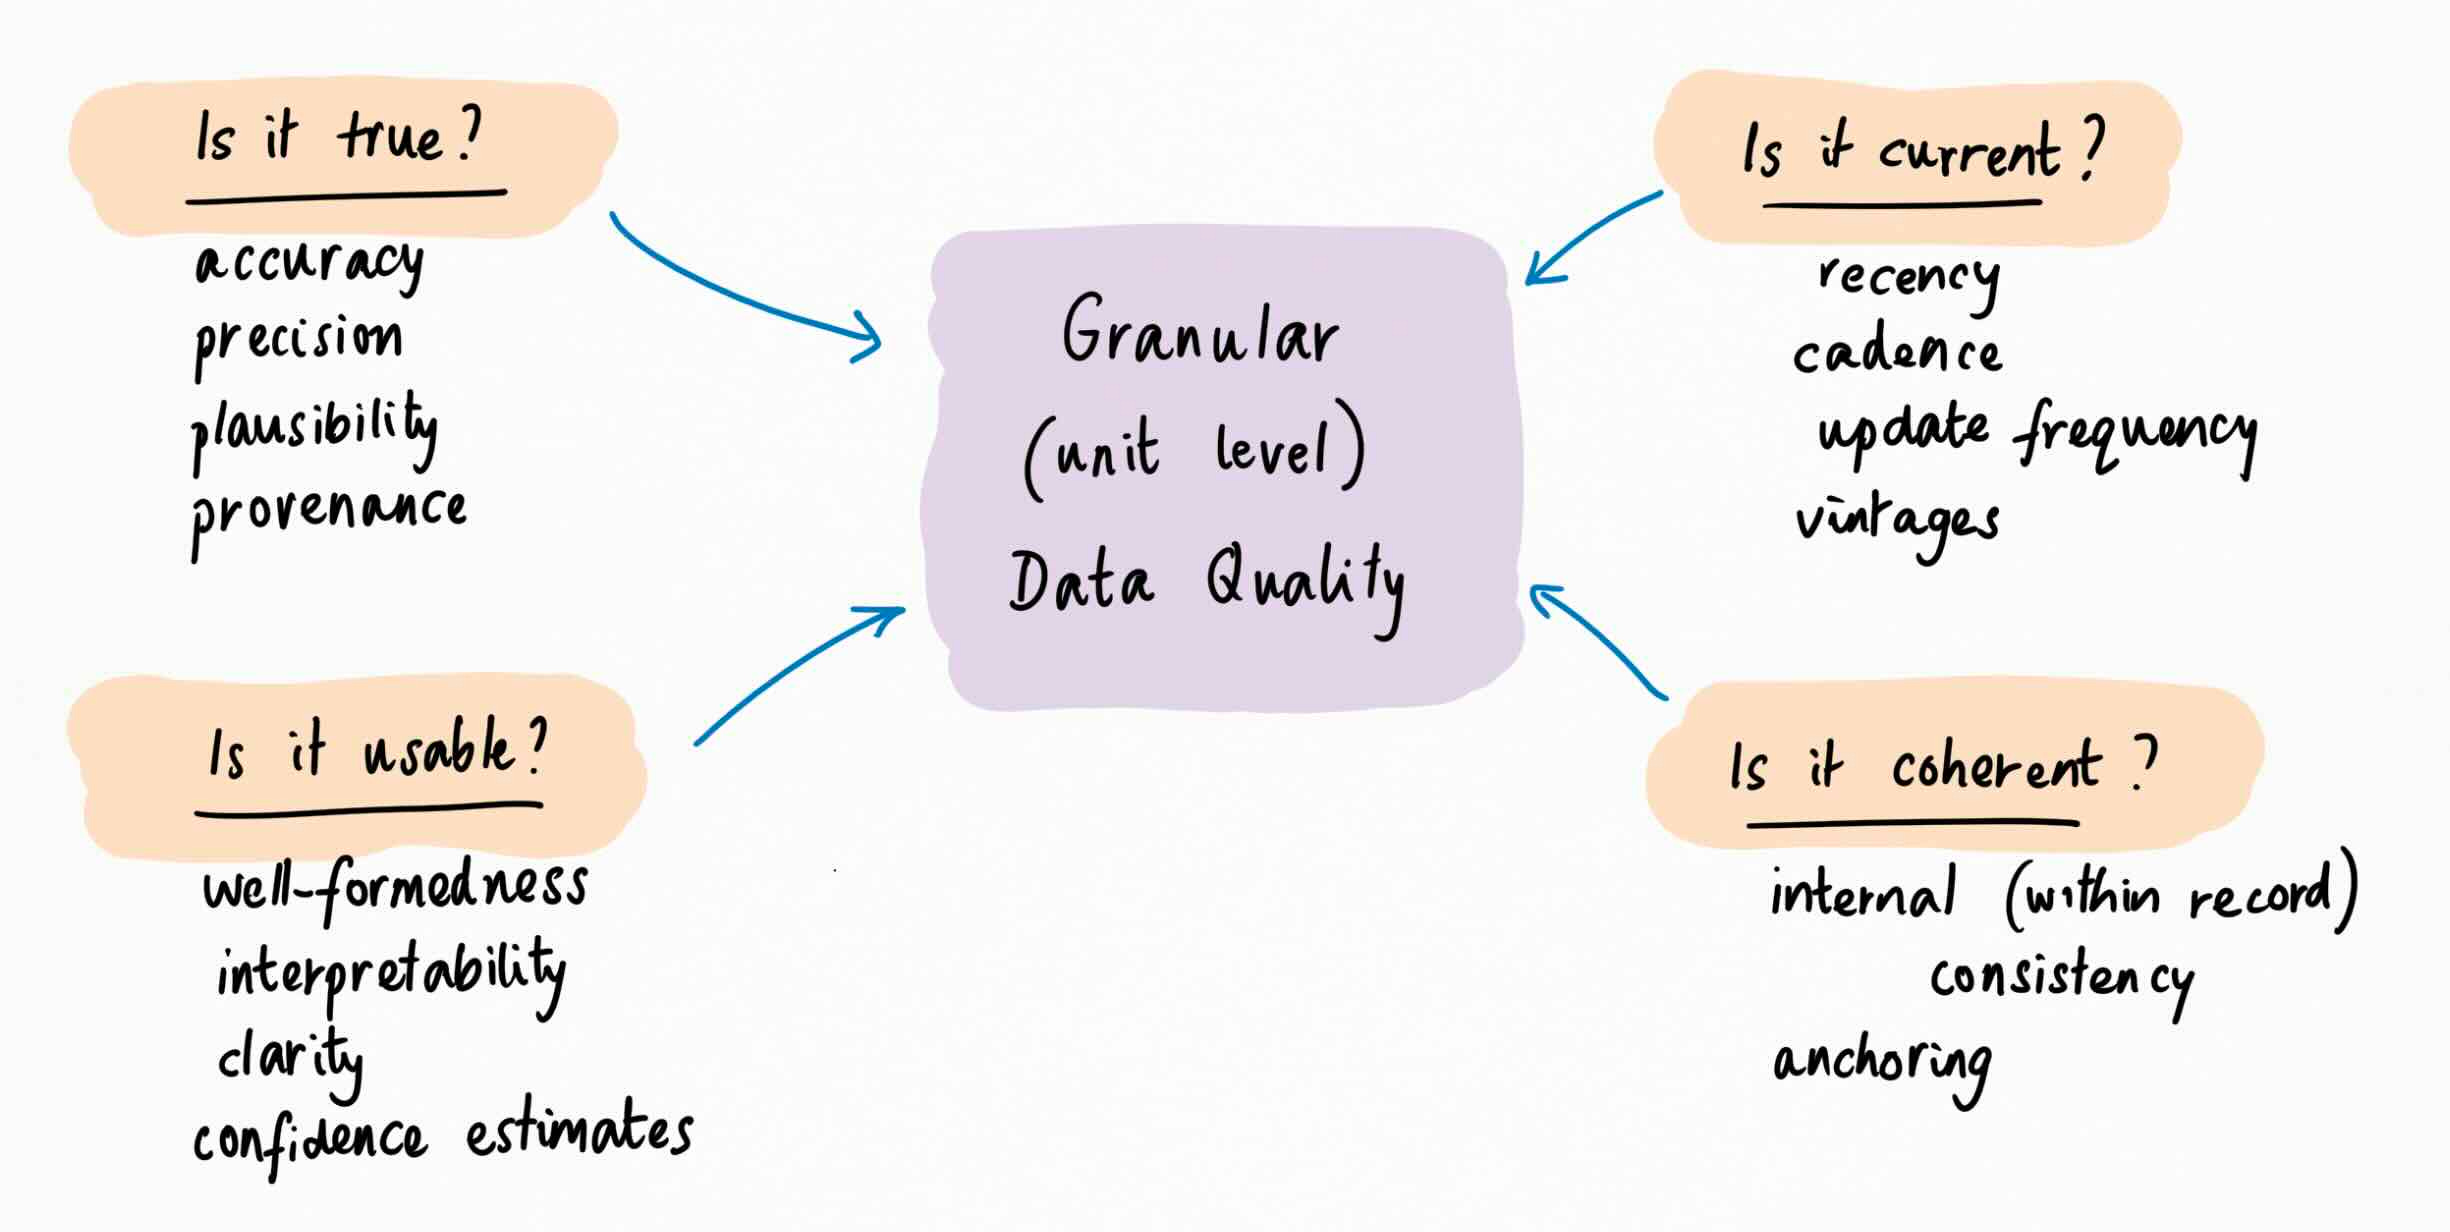
Second, all these attributes are downstream of clear usage/value questions: is the data true, is it usable, is it current, and is it coherent? And the questions themselves are conditional. True, in what context? Current, relative to what? Usable, how?
Example: Revenue
Consider the most basic of financial data, revenue. Imagine you’re a CFO, or perhaps a founder hoping to one day be able to afford a CFO.
It’s all too easy to book the wrong revenue number2 – to misread contract terms, renewals, discounts, one-off versus recurring, and so on. You need to be extremely careful to ensure granular data quality for this field.
But even if you’re careful and capture revenue perfectly: what number should you use? Say you’re a marketplace. Some marketplaces report net, others report gross3. Which is correct?
Well, it depends. Are you an active, value-adding seller; did you set the price; are you on the hook for the service? Or are you just a matchmaking middleperson? Reasonable minds – and auditors – can differ on that question, and by extension, on their evaluation of data that happens to tilt one way or the other. So much for innate data quality!
Aggregate Quality
The second level of data quality is aggregate or corpus-level quality.
All your individual units or records might be high-quality, but that doesn’t mean your data corpus is high-quality. At corpus level, you care about attributes like coverage, deduplication, granularity, representativeness and balance, cross-record and label consistency, distributions and aggregate statistics, volume and sufficiency, continuity, joinability, and drift.
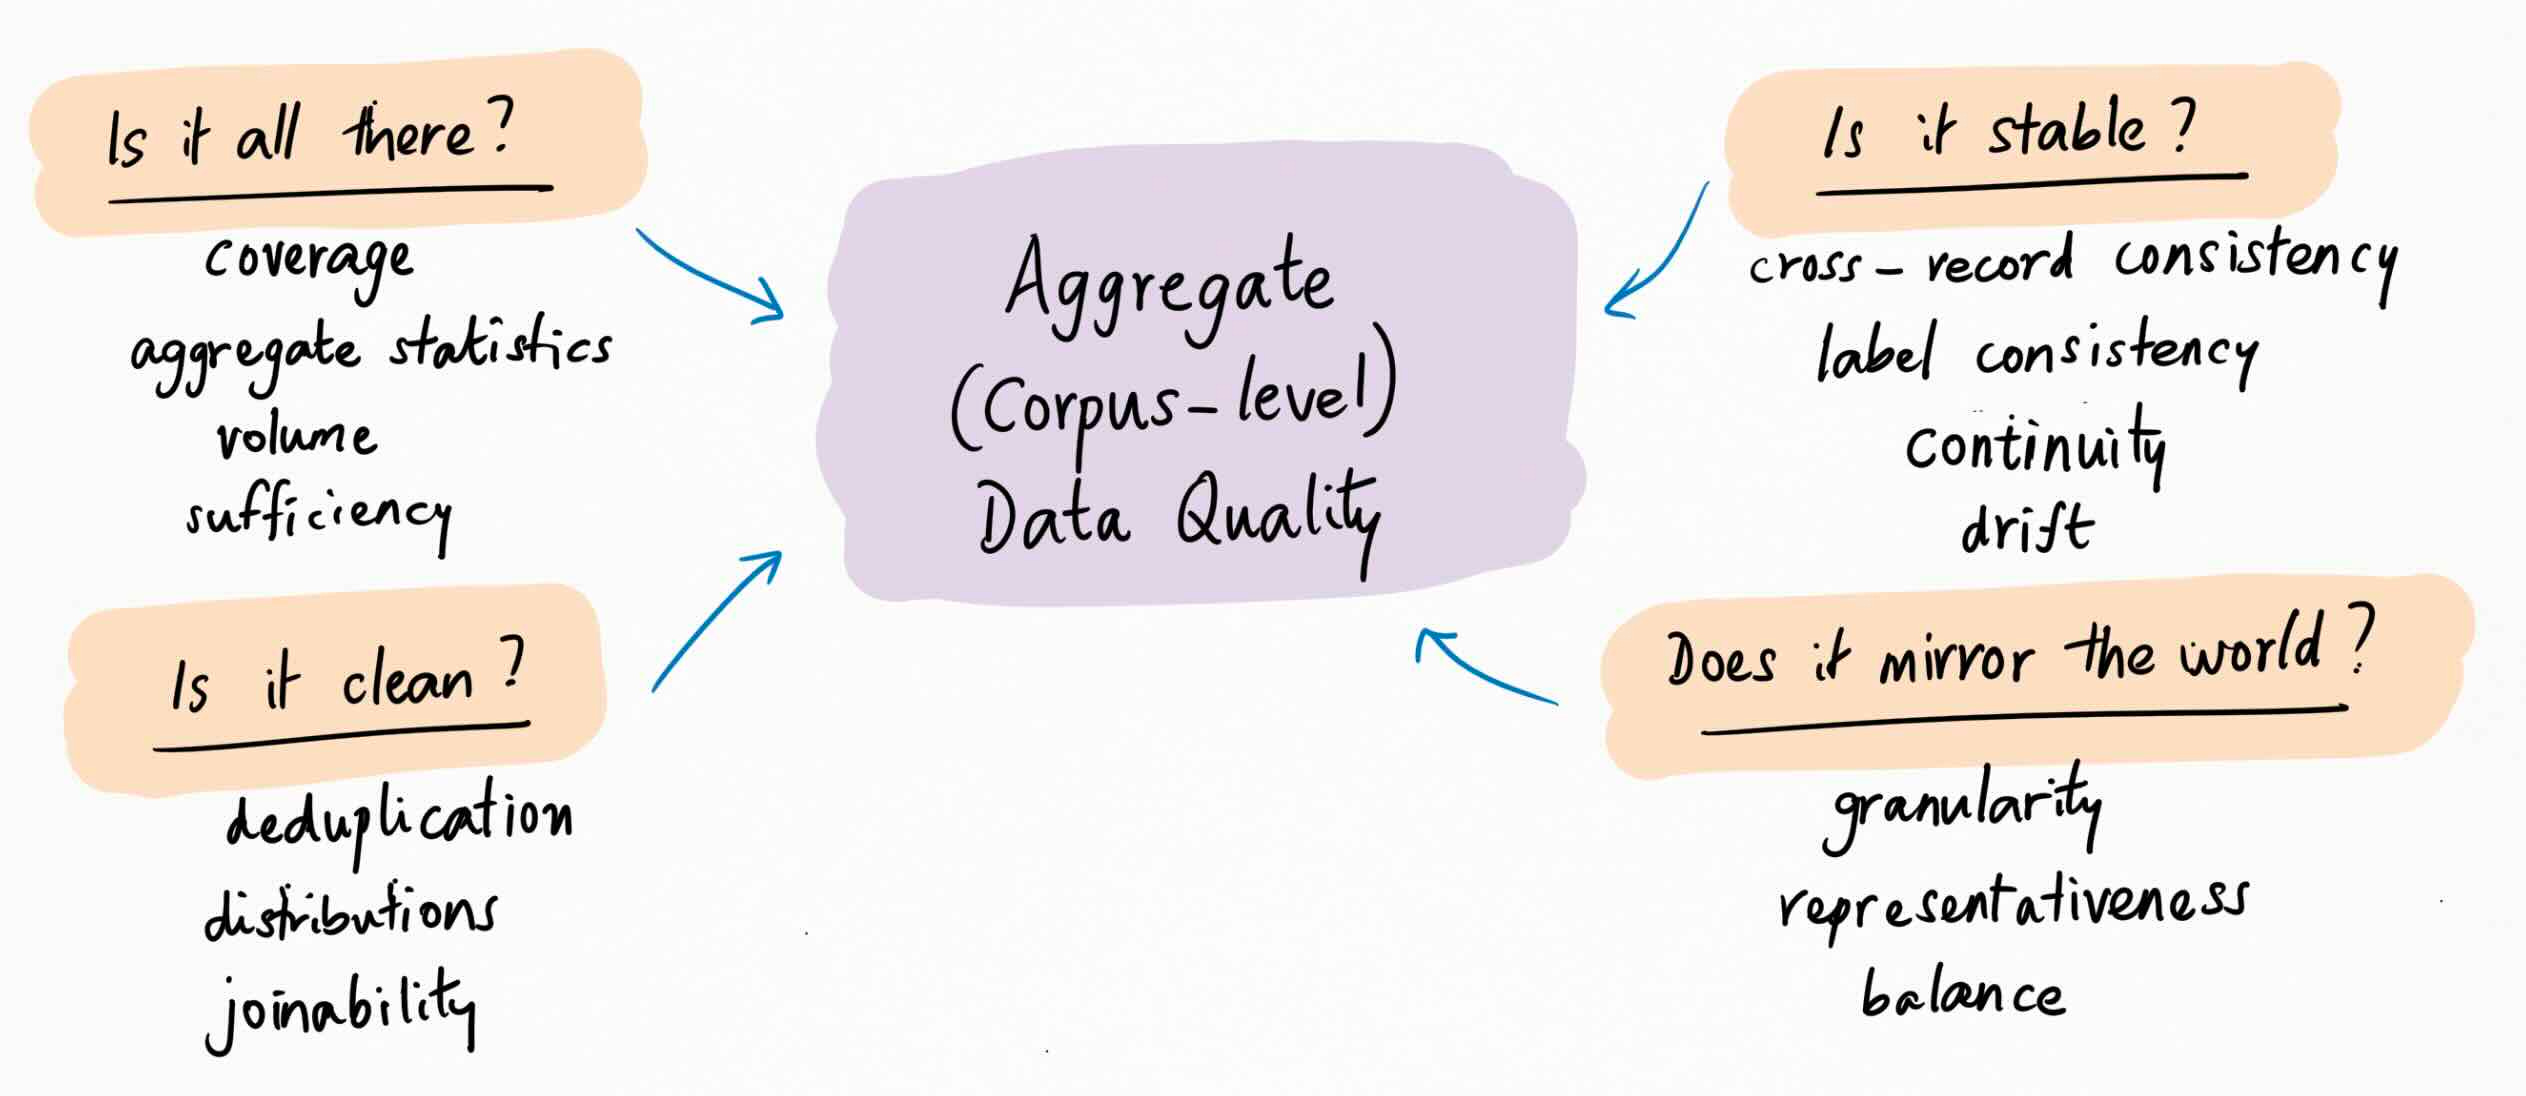
These are attributes that emerge from your data taken in aggregate; no individual piece suffices to establish these attributes. The questions being addressed here are: is the data all there, is it clean, does it mirror the world, and is it stable over time and space?
These questions too are context and use-case specific: what does “all” mean, how clean is clean enough, what’s the world being mirrored, what are the time and space constraints. Again, the reason we ask these questions is because without knowing the answers, we can’t use and get value from the data.
Example: Revenue, continued
Every individual revenue event might be properly selected and accurately captured. And yet: what if definitions changed halfway through your historical data? What if you’re missing some revenue entries and double-counting others? What if the numbers simply don’t reconcile?
These are all aggregate data quality questions that cannot be answered with just one unit or record. But they’re reasonably easy to answer given the full corpus.
The harder questions are those that involve application: where corpus meets use case.
Let’s say you’re trying to build an expansion forecast. How useful is your current corpus? It’s a perfect snapshot of current customers (high quality for accounting and reporting), but may not be representative of your future customer pool (low quality for forecasting). Use case determines quality.
Fitness for Purpose
The third level of data quality is fitness-for-purpose quality.
Quoting Pivotal4 :
It’s meaningless to talk about data value [and hence data quality – ed.] without specifying how the data will be used. Financial statements aren’t useful for an advertising campaign. Audience profiles aren’t useful for equity analysis. But flip those around, and the datasets are not just useful; they’re essential. The use case is everything.
We’ve already talked about how granular quality and aggregate quality are questions you ask of the data, conditioned by use case. Fitness-for-purpose is where the questions shift to the interaction between data and application.
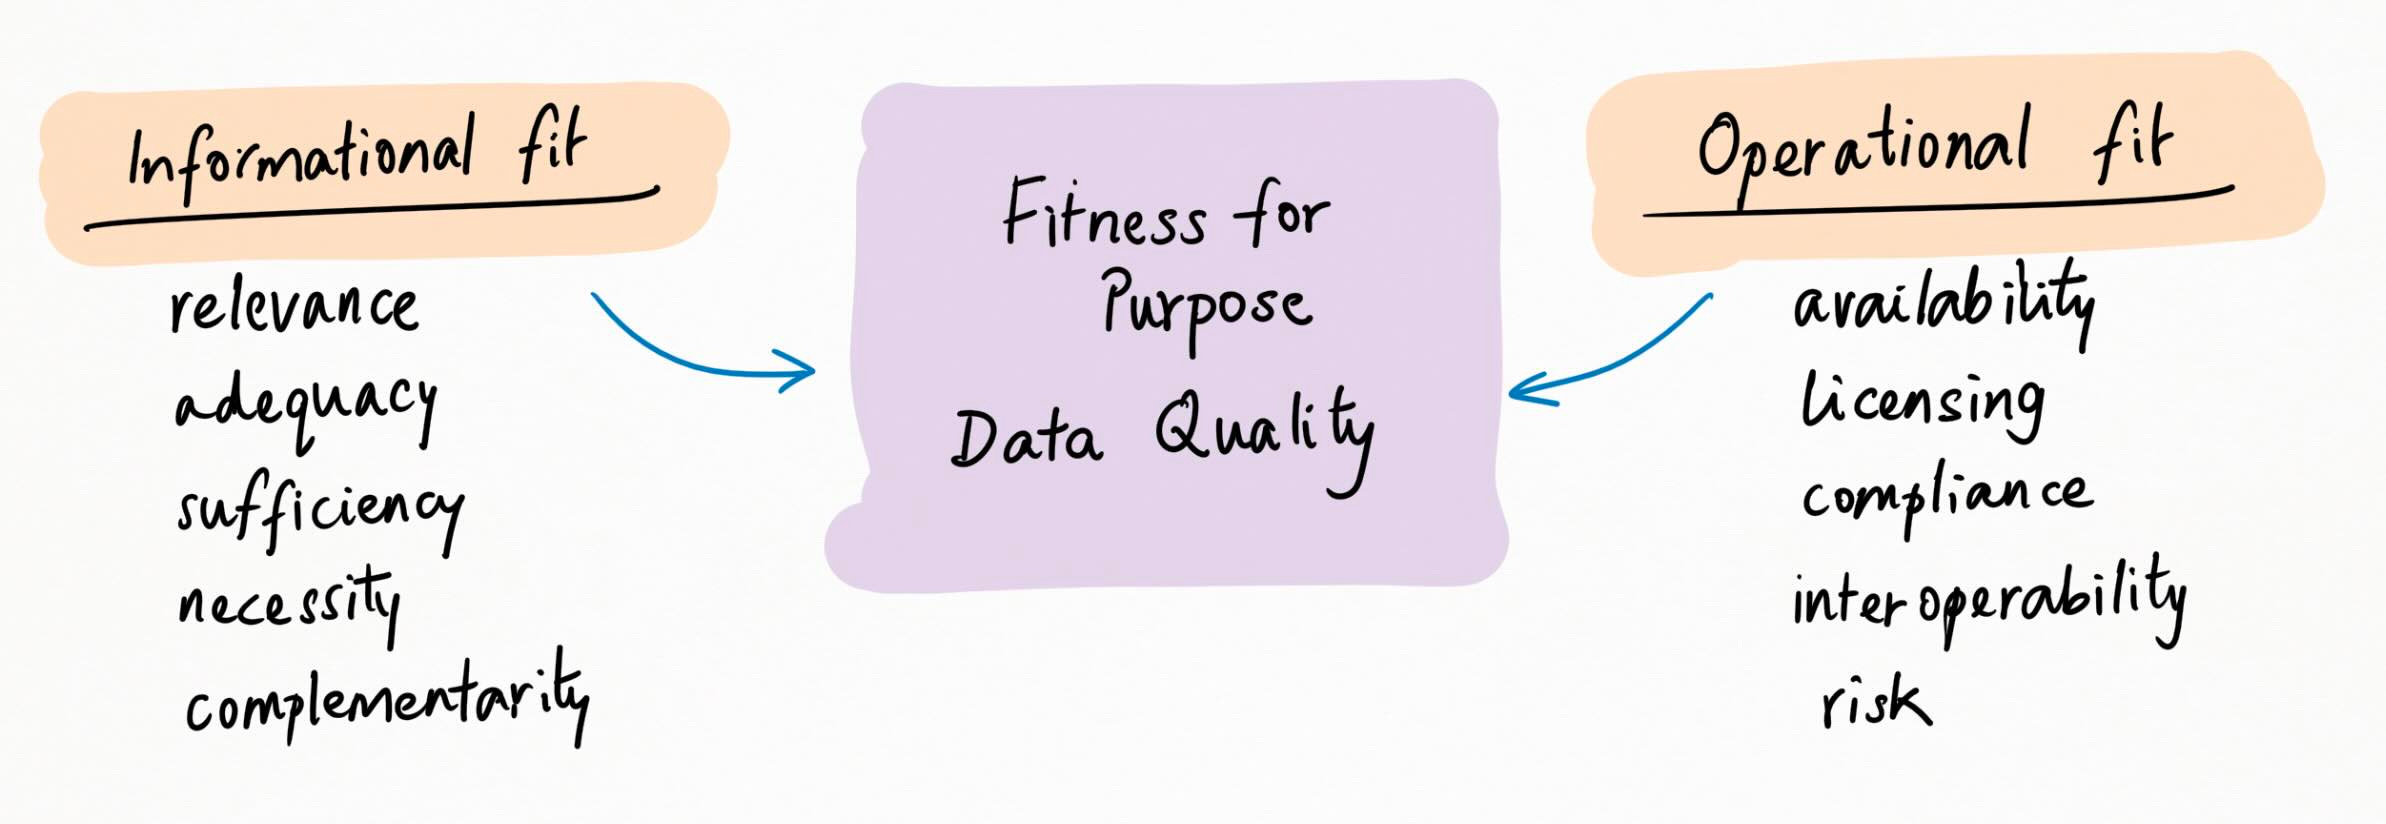
This takes a couple of different forms. There’s “informational fit”, which includes data relevance, adequacy, sufficiency and necessity – in short, does the data answer the questions you want answered? And there’s “operational fit”, which includes data availability, licensing/compliance, interoperability, and risk/reward calibration – in short, can you use the data effectively?
Example: Revenue, continued
Calculating revenue perfectly takes time: even the best-run finance departments take a few days after month-end to close the books. But for a CEO, this is often too late: investing, cutting, hiring and firing decisions might need to happen during the month that revenue deviates or surprises. What’s high-quality for an auditor is low-quality for real-time execution.
Timing is not the only mismatch. A finance team might produce beautiful, granular, detailed books that nobody outside the finance team will ever use. Boards want the TLDR, the CMO wants attribution, sales wants to know their bonus pool; and nobody wants 40 tabs of VLOOKUPS. In fact the very attributes that make the data high-quality for finance (detail, nuance, caveats, every possible slice and dice) make the same data low-quality for other users. The use case is everything.
Business Value
A dataset might have great unit-level quality, excellent corpus-level attributes, and perfect fitness-for-purpose. That’s still no guarantee that it will add business value. You can do everything right, and still fail.
This brings us to our final facet: business-outcome quality. Does the data actually deliver value to the business? Does it lead to higher eval scores, or stickier enterprise revenue, or superior risk-adjusted returns, or better customer conversion? This, ultimately, is what we care about: the value of data, and the measure of its quality, is the value of what we can do with it.
As before, you can break this down into a few questions: was the data used, did it change anything, and was the change worth it?
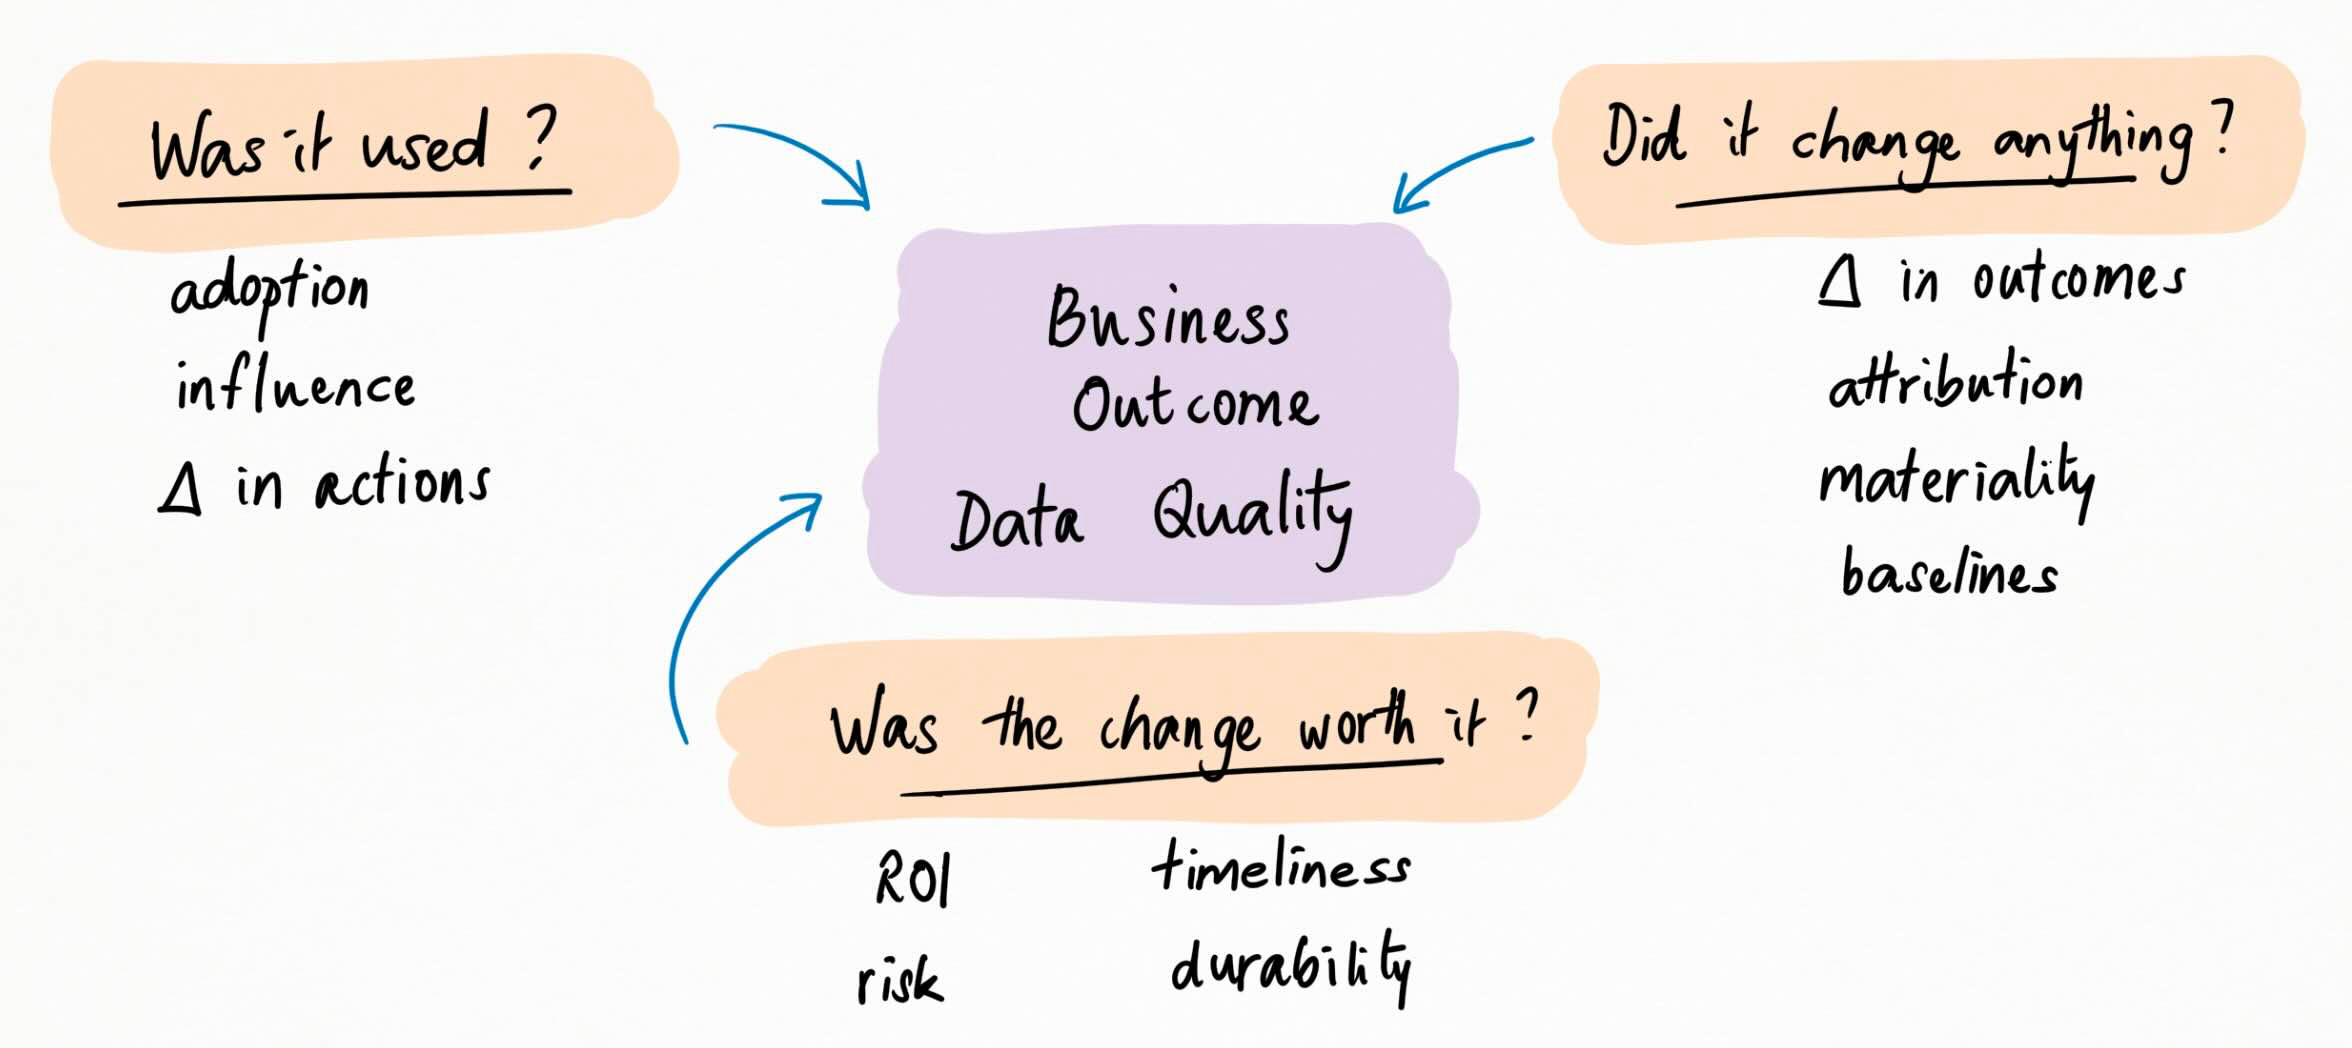
“Was the data used?” means measuring data adoption, influence on decisions, and delta in actions. “Did it change anything?” means measuring delta in outcomes, attributing it correctly, and judging materiality. And “was the change worth it?” encompasses ROI, timeliness, durability and risk.
Example: Revenue, continued
Consider – just for a change – a company’s revenue data. You’ve done everything right: after years of winging it, you finally have well-defined, accurately captured, bias-free, user-aligned revenue data. Great. Now what?
Maybe, armed with this shiny new revenue data, you decide to rejig your sales team’s bonus structure. And of course your sales team games the new formula: pulling revenue forward to unlock accelerators, offering discounts that kill your margins, chasing easy low-quality closes over the hard wins that drive value.
It’s a tale as old as time. The data was great: high-quality at granular, corpus and fitness levels. It just didn’t deliver the business outcomes you hoped for.
And so the answer is not about the data itself. (That’s what the lower levels are for!). The answer is forming better hypotheses about the value the data will deliver5, instrumenting the data-usage-result pathway, and scaling back or doubling down as the results indicate. This is the secret: at the highest level, data quality is not about the data. You have to zoom out.
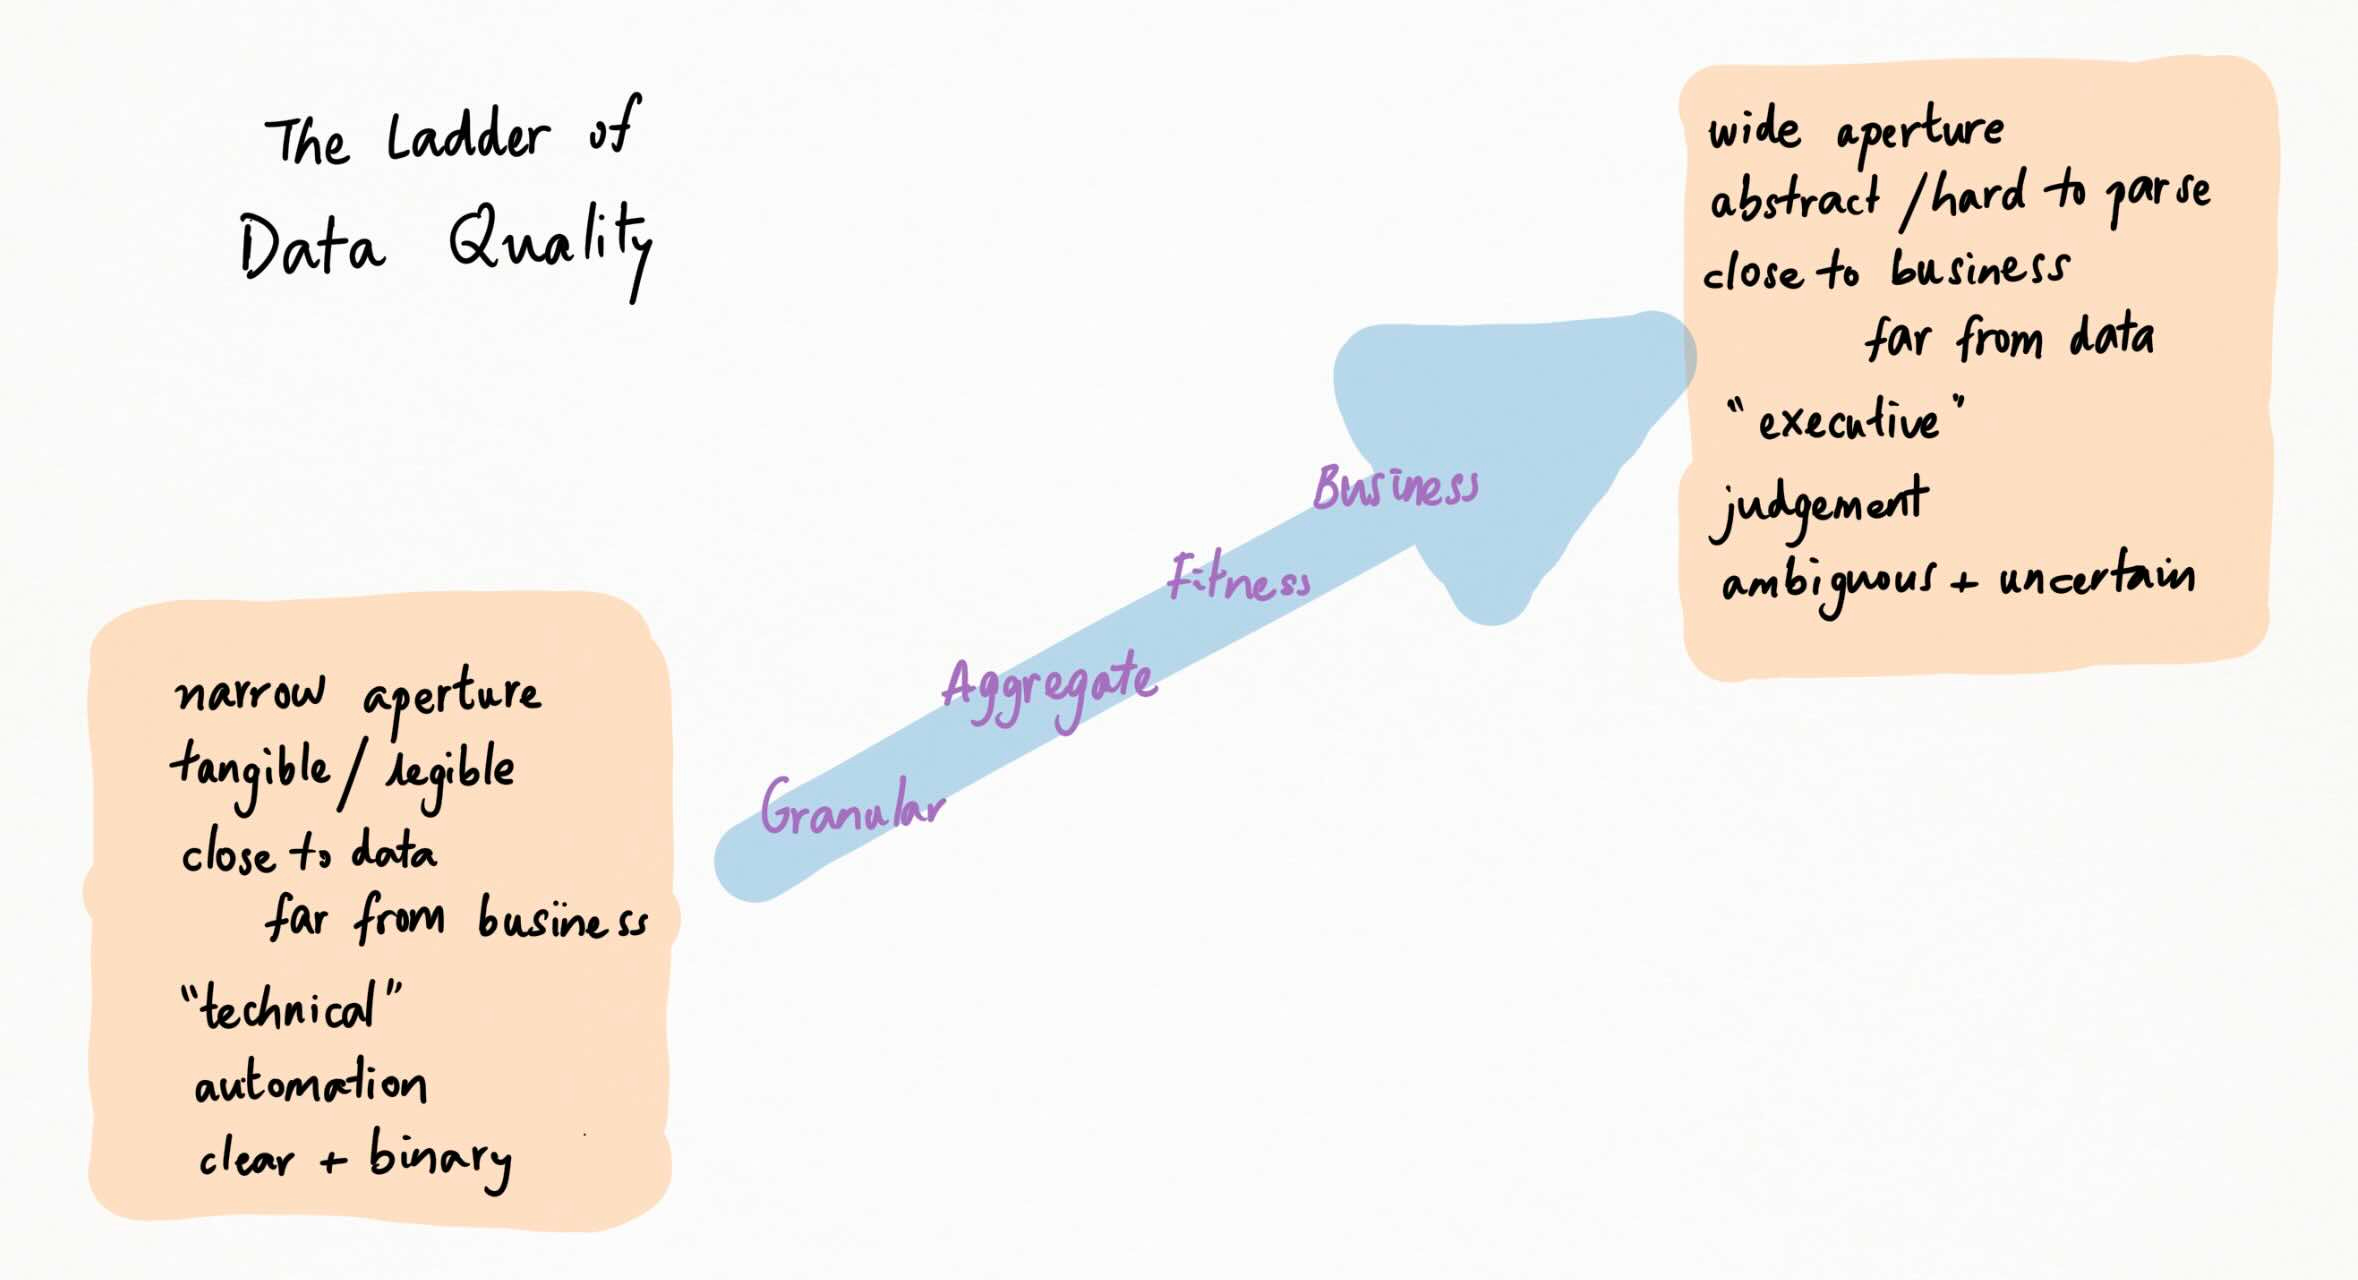
Quality is a Ladder …
The levels I just described are ordered and dependent. You can’t get to the higher levels of data quality (fitness for purpose, business outcomes) without first traversing the lower levels (granular and aggregate quality). But the lower levels generate no value in themselves. You need both.
Quality is a ladder. The lower rungs enable the higher ones; the higher rungs justify the lower ones.
This resolves the definitional problem we started with. The failure mode of ISO 25012 is endless checklists, aka getting stuck at the lower levels – “we measured the data against 127 quality dimensions, yet our business remains unimproved; now what?”. The failure mode of ISO 8000 is non-actionable tautologies, aka getting stuck at the higher levels – “this data is good because it does good things; now what?”.
Quality as a ladder is the organizing principle that subsumes and transcends both of these definitions. At lower rungs, ask yourself: am I tunnel-visioned on attributes and neglecting my business use case? At higher rungs, ask yourself: am I tunnel-visioned on results and neglecting foundational hygiene? Everything else follows.
Many disputes on data quality are the result of people operating at and talking about different levels of the ladder. Hence the elephant. It’s hard to tell a meticulous data ops engineer that their perfectly labelled records have no business value; it’s equally hard to tell a visionary CEO that their perfect operating model is built on sketchy input data. The former’s instinctive response to problems is to look for granular fixes; the latter’s is to look for a strategy that works. Neither is a panacea.
… And You Shouldn’t Skip Steps
Good data hygiene means doing all the things: confirming unit-level, corpus-level, fit-for-purpose, and business-outcome quality.
This is hard. And so the temptation is to skip steps. There are two bad ways, and one maybe-okay way, to do this.
First, the two bad ways:
Failure to launch. Focus too much on the lower rungs of the ladder; build immaculate quality at granular, aggregate and purpose levels; deliver zero business value. This is astonishingly common, probably because it’s easy. The lower rungs are tangible, measurable, easy to impact - in a word, “legible” - and so that’s where people tend to focus.
Failure to ground. The opposite problem: ignore the lower rungs, and jump straight to solving for business value. If your target is well-defined and your feedback cycle is fast enough, this might work. The rationale here is that the (business) end justifies the (data) means – who cares about correctness, provenance, timeliness et al, as long as the results are good. But this is usually not sustainable; foundations matter.
The maybe-kinda-sorta-okay way is:
Provenance as proof. Borrow quality from elsewhere; let somebody else do the work. If your source is unimpeachable – if you trust their data implicitly – then you can invest materially less in checking unit-level and corpus-level quality. Meanwhile, fitness-for-purpose can be solved by sticking to vertical-specific providers. (Of course, you still have to generate business-value yourself.)
Note that trust in data sources doesn’t happen by accident; it’s built up over time, with resources, and through results. Above all, it’s endogenously determined. If and as long as the data works, you trust the source; if and when it doesn’t, your trust dissipates.
Taking a Breather
This concludes the first part of this essay:
why data quality doesn’t really exist on its own;
how to think about it in layers;
the quality ladder; and
how to avoid getting stuck on any one level.
In the second part, AI! How does AI change our intuitions about data quality? Spoiler: in a bunch of cool, non-obvious, and interesting ways. Stay tuned!
And in the mean time, :
Toronto, June 2026
I’m not going to define all of these terms; Claude is your friend.
Unintentionally. It’s even easier to do it intentionally, but I wouldn’t advise that.
Yet others report community-adjusted. Again, not advisable.
An excellent newsletter on data, finance and AI, that you should all definitely subscribe to.
And if you can’t do that, then what are you even doing here?
this is a must read from a data legend